The Russia-Ukraine War as a Regressive Global Tax: The Effect of Commodity Terms of Trade on Developing Economies

“Correct economic law recognizes that some American groups can be hurt by dynamic free trade. But correct economic law vindicates the word ‘creative’ destruction by its proof [sic] that the gains of the American winners are big enough to more than compensate the losers. The last paragraph can be only an innuendo. For it is dead wrong about necessary surplus of winnings over losings…”
At its core, Paul Samuelson’s controversial 2004 statement about gains from globalization not necessarily being positive was a straightforward argument about terms of trade (i.e., the ratio of an economy’s export price index to its import price index). The real income of a nation rises and falls with its terms of trade. However, even though real income necessarily rises through this channel when an economy moves from autarky to free trade – and hence overall welfare necessarily rises – there are no guarantees that subsequent terms of trade changes will be positive. All manner of shocks, from differences in trend productivity growth, as contemplated by Samuelson, to other higher frequency innovations to global relative prices, raise the specter of negative real income shocks via international price linkages.
Today, some of the largest global price shocks are emanating from the Russia-Ukraine war. The most direct transmission of the conflict to the global economy operates through the prices of energy, food and other basic materials (herein referred to simply as ‘commodities’) and, indeed, aggregates of commodity prices rose sharply following Russia’s February 24th, 2022, invasion. This increase reflects the direct effect of Russian and Ukrainian commodity supply being taken offline by the war and economic sanctions on Russia, but also the interactions of geopolitical tensions with pre-existing supply chain backlogs.
How will the ripple effects of the war affect commodity importers and exporters? In this essay, I argue that the war-related commodity price shocks are most harmful to low- and middle-income countries, which tend to be larger net importers of commodities relative to the size of their economies. Hence, the war’s terms of trade effects are unequally felt along the importer income spectrum. While many commodity-producing countries are enjoying net terms of trade gains, there is little to indicate that the distribution of export gains is any more progressive.
The shock to commodity prices is not a tax per se, but it shares much in common with a hypothetical global tax on commodity prices and its effect on importer real income. Not least, the low elasticity of demand of commodities for final consumption (or inputs into manufactured goods) translates into a high incidence of the tax on importing nations. Moreover, this logic follows prior studies in tracing the international links between tax or subsidy policy, commodity trade balance, and real income.
Commodity supply shock
The magnitude of commodity price movements since the onset of war in Ukraine has been sizeable. For example, the Bloomberg Commodities Index, which aggregates a basket of energy, agricultural, and metal futures prices, increased by 13% between the invasion date and the end of April 2022. Excluding gold and silver from the index and reweighting, the increase was 17%; and starting a month prior to the invasion to account for the buildup in tensions, the reweighted index rose by 28%. As illustrated in Figure 1, prices rose broadly following the invasion, with initial volatility giving way to a more persistent level shift in prices, on average.
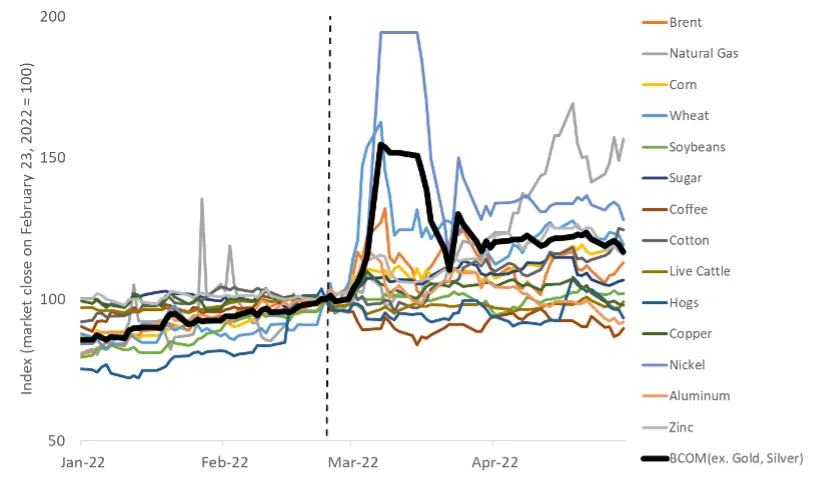
Figure 1: Commodity price changes post-Ukraine invasion
Source: Bloomberg, author calculations.
Consistent with the idea that commodity prices rose due to war-related supply disruptions, the effects have been more pronounced in those commodities with heavier reliance on Ukrainian or Russian export supply. Natural gas is the clearest example, wherein 17% of global exports come from Russia or Ukraine; following the invasion, the futures price of natural gas increased by 80%.
More generally, commodity price increases have been positively correlated with the Russia and Ukraine export share (Figure 2). One can tell a story like that of natural gas for oil, corn, nickel and wheat, the prices of which are uprose by roughly 30-40 percent over that period, and with each having a substantial share of global export supply from Russia or Ukraine. In contrast, the price increases of coffee, live animals, sugar and zinc were more moderate and have far lower direct exposure to supply constraints emanating from the war.
While these observations are by no means definitive in linking global price rises to constrained supply in Russia and Ukraine, they are highly suggestive of a causal link for at least a subset of products. At a minimum, it is fair to say that the conflict has exacerbated the mismatch between global supply and demand for certain commodities.
Terms of trade effects
To gauge the extent of distributional effects from rising commodity prices, the key statistic is countries’ trade balance with respect to those commodities. These balances for the year 2019, normalized by each country’s total amount of trade value, are shown in Figure 3 for all countries in the UN Comtrade International Trade Statistics Database. The scatterplot illustrates the relationship of commodity trade balance with real per capita GDP for net commodity importers (left panel) and net exporters (right panel).
The first observation that sticks out is the negative relationship between the trade balance of commodity importers and their income per capita. On one hand, there is no country with both GDP per capita greater than $22,000 and commodity import share greater than 10 percent. On the other, most of the countries with the greatest commodity import share (Mauritania, Gambia, Afghanistan, Sao Tome and Principe, Lebanon, Yemen) are well below the median national GDP per capita of $14,585. In the cross-section of importers, doubling GDP per capita corresponds, on average, to a commodity share that is 2.4 ppt. higher (p-value = 0.000).
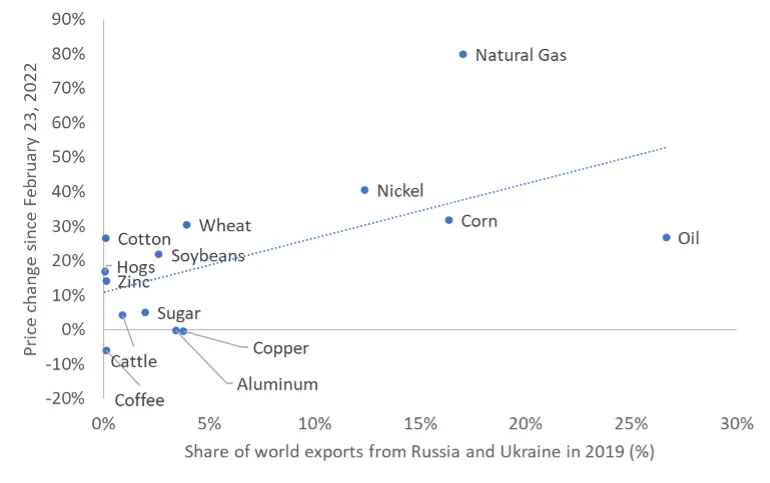
Figure 2: Commodity price changes and the share of exports coming from Russia or Ukraine
Source: Bloomberg, UN Comtrade International Trade Statistics Database, author calculations.
This positive relationship also exists when looking at the commodity net exporters, although it is much more diffuse. The right panel of Figure 3 shows a large spread of commodity export intensity, with many more countries in the 20-40% export share range spanning the income distribution. At the margin, export share rises with income. Of the 10 most intensive exporters, each with an export share of greater than 30%, 6 have per capita GDP above the median national level. In the broader cross-section of exporters, doubling GDP per capita corresponds, on average, to a commodity share that is 3.6 ppt. higher, though it is not a statistically significant correlation (p-value = 0.24).
The argument that the Russia-Ukraine war is a regressive tax reflects the combination of these two observations. For net commodity importers, higher prices disproportionately affect the economies of poorer countries, for whom trade in commodities is a larger fraction of economic activity. On the export side, the transfer of real income from importers is channeled more evenly across the income distribution.
There are two important caveats to this argument. The first is the implicit assumption that commodity terms of trade shocks are purely exogenous from the perspective of countries outside of Russia and Ukraine. That is not always the case. For oil and gas exports, for example, the conflict itself involves the strategic use of export supply as a source of hard currency and bargaining leverage for Russia. Therefore, the size of the actual supply shock is somewhat less than the sum-total of Russian and Ukrainian commodity exports.
A related caveat is that spillovers to economic activity in non-conflict countries – outside of the price effects of the commodities themselves – may be large. Input-output linkages in international supply chains introduce knock-on effects to quantities in an array of other industries. For example, the ability of Brazilian producers to export soybeans will be affected by the negative supply shock to Russian fertilizer exports, partially offsetting the benefit from higher soybean prices.
Concluding thoughts
What explains the regressive nature of the Russia-Ukraine terms of trade shock? Part of it has to do with the underlying structure of developing economies, including the fact that the composition of spending in poorer countries is simply more commodity intensive. But it also may reflect a more subtle interaction of the globalization process and economic development.
For a subset of countries, globalization since the late 1990s – in international trade, migration and capital flows – was a powerful engine for economic development and convergence. For example, trade between China and the rest of the world burgeoned over that period, income per capita rose, and China’s intensity of commodity trade declined. By 2019, it was a net importer of commodities, but those flows accounted for only 6% of total trade.
Clearly, however, a broad swath of developing economies did not capitalize on the globalization trend in the same way, leaving both their income and non-commodity trade levels lower than if they had they been able to. From today’s perspective, the 1990s and early 2000s look very much like the zenith of the globalization process. In a world of more regional, more cloistered, trade patterns it is unclear whether one of the windows for commodity transition has already closed.
Benjamin Mandel is Head of Portfolio Strategy at Itaú Asset Management.