Emerging markets and the hiking cycle: this time, really, it may be different
The relationship between emerging markets and monetary policy in developed economies is once again relevant as inflation in the US and Europe (and most of the world) runs significantly ahead of targets. As a result, the Fed, the European Central Bank, and the Bank of England have started what could be a multiyear tightening cycle. Quantitative easing (QE) has been replaced with Quantitative Tightening (QT) aimed at contracting these central banks’ large balance sheets, and short and long-term interest rates in the major economies have started to rise.
Given that more than fifteen years have passed since the last meaningful global tightening cycle, we believe it is pertinent to look at the emerging markets today and ascertain how the changes in size and structure of these markets during this period may alter how the impending tightening cycle will impact them.
Our conclusion is that this time, it really may be different, with emerging markets assets in a better position to absorb higher global interest rates. The reasons are the following:
- Despite a significant increase in private sector debt, there has been a notable improvement in emerging markets’ foreign currency denominated public sector balance sheets. This is the result of rapid foreign exchange reserve accumulation.
- In the equities market, a double phenomenon suggests a different, more benign, response to higher global rates. First, Asian economies such as rapidly growing China and India account for almost 80% of market capitalization. Second, the technology and financial sectors now account for half of the markets, resembling a shift from traditional commodities-focused emerging markets.
- While a strong dollar would hurt EM FX, we believe that a currency crisis is less likely. In addition to stronger balance sheets, many emerging markets central banks are further along in their hiking cycles than the Fed and other DM central banks and display significantly higher real (in some cases positive) interest rates.
Tighter global liquidity is likely to negatively impact all risk assets, emerging and developed. However, we argue that, because of changes that occurred in the last two decades in the size and structure of EM economies and markets, they are better positioned to withstand a global tightening cycle. Some of these changes have brought about new, more idiosyncratic risks, such as the exceedingly rapid growth of private sector debt and regulatory uncertainty in China. These and other risks deserve close monitoring, but a large crisis in emerging market economies or financial markets in the current hiking cycle seems less likely than in the past.
Background: some history of hiking cycles and EM
“Only when the tide goes out do you discover who's been swimming naked.”
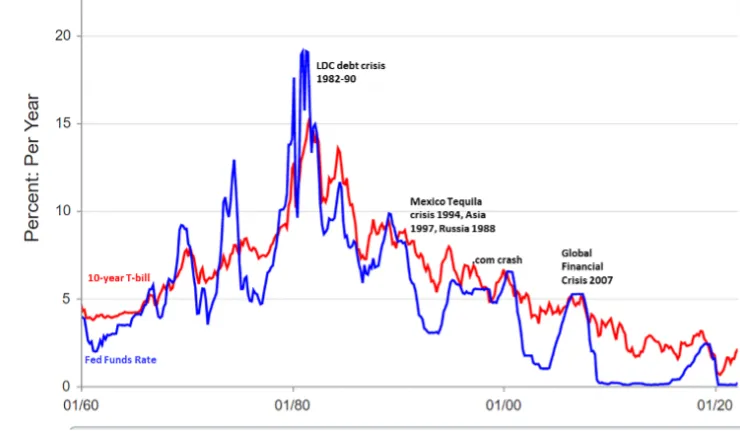
Warren Buffett’s famous investment metaphor is used often to describe the impact of global liquidity cycles on emerging markets. Historically, weak institutions, shallow trading, subpar regulation, political risks, and macroeconomic imbalances in emerging countries are overlooked by global investors in the upcycles of global liquidity. Sadly, these vulnerabilities then rise to the forefront as investors flee these markets when global liquidity recedes. In fact, most major emerging market crises have been associated with periods of liquidity tightening, as shown in Figure 1. The LDC debt crisis, which started in 1982, was linked to Fed Chairman Paul Volcker’s forceful and effective efforts to tame inflation in 1980-81; the so-called Tequila crisis in Mexico was in part triggered by Fed tightening starting in February 1994; the Asian financial crisis of 1997 occurred as interest rates in the US remained high and Japanese-fueled liquidity dried up for emerging Asian markets on the back of the real estate and stock market crash in Japan (which itself resulted from the Bank of Japan hiking interest rates in the early 90’s). The Fed hiking cycle that preceded the “.com” market crash in 2000 and the 2008 Global Financial Crisis (GFC) did not produce an emerging markets crisis (in both cases problems were more severe in the developed world) but still caused disproportionate declines in EM asset markets, and equity markets in particular.
Figure 1. Emerging markets crises and US interest rates
Source: Federal Reserve Data and authors’ additions
However, not all periods of high global interest rates have caused a debacle in emerging markets. Table 1 shows annualized returns for the major EM fixed income, equities and FX indices dating back to 2000 side by side with the US Fed Funds Rate.
As seen in the above table, there have been many periods of solid EM returns despite high US interest rates. EM indexes have underperformed DM assets for the last couple years due to pandemic-induced risk aversion in early 2020. Additionally, global tightening expectations resulting from the “sling-shot” recovery of the US and world economy induced by unprecedented fiscal and monetary stimulus to mitigate the economic effects of Covid-19 coupled with disruption to global supply channels caused a jump in inflation expectations.
The following section will explore the structural changes in EM asset markets during the last 20 years to ascertain whether this underperformance is justified by fundamentals and likely to continue resembling observed behavior of EM assets in previous hiking cycles.
Hard Currency Credit markets: higher debt levels but more diversification and stronger external balance sheets
More geographic diversification
In the last 2-3 decades EM hard currency debt benchmarks have undergone important changes. The widely used JPMorgan EMBIG Diversified Index now consists of 82 countries, compared to 27 countries in 2001. In recent years, new issuers from Africa and the Middle East have tapped the hard currency bond markets, resulting in an asset class that is much more geographically diverse. Today, Latin America and Caribbean bonds account for 30% of EMBI, down from 66% at the start of 2001. By contrast, the Middle East accounts for 20%, up from 0.3% in 2001. African credits have seen their share go to almost 14% from just under 4% in the same period, while Asia has risen as well, from 12% to 19%, see Figure 2. Today, 50% of the EMBI index is made up of Investment Grade countries, compared with under 15% in the late 1990s and around 1/3 in 2001.
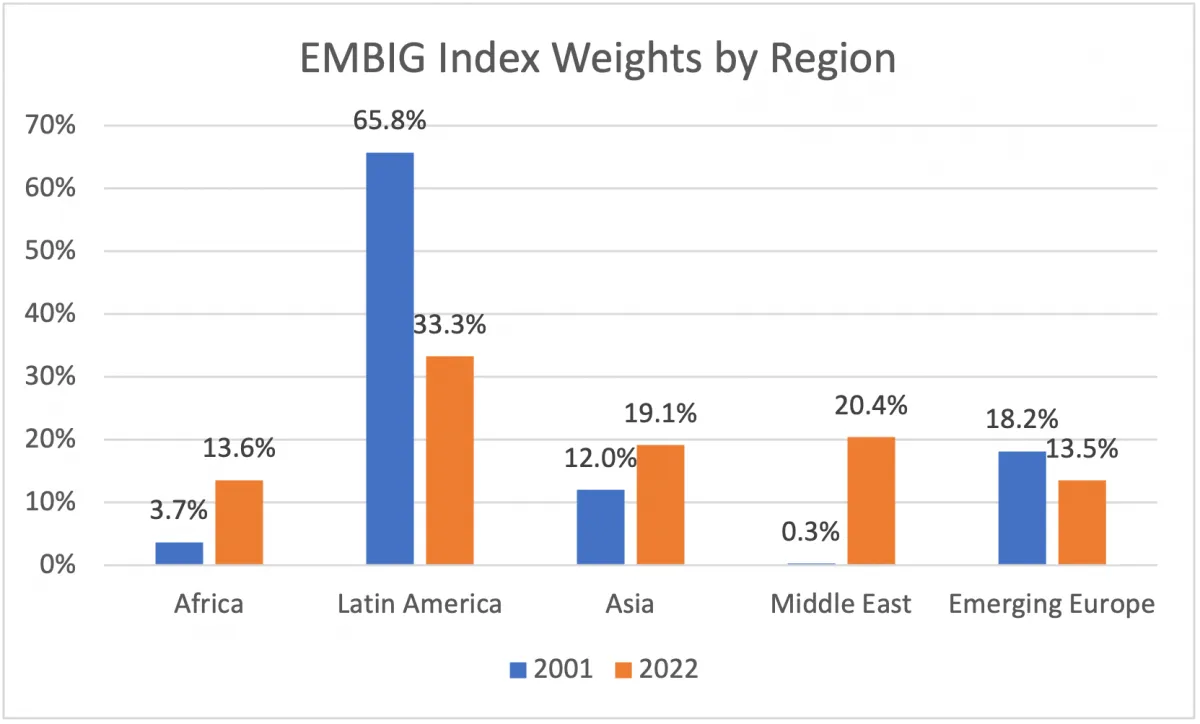
Figure 2. Regional composition of the EMBIG Index, 2001 and 2022, percent.
Source: JPMorgan
When looking at the credit fundamentals of the emerging market hard-currency asset class as represented by the EMBI benchmark, we find that the weighted average indebtedness of the Index in both local and foreign currency has increased from 2001 to today, see Table 2. This likely is the reflection of four factors: (i) the development of deeper local currency funding markets that governments can more easily tap; (ii) the broadening of the index to include countries with relatively high indebtedness; (iii) the low cost of financing seen in the last decade which allowed debt servicing to remain manageable even as total debt rose; and (iv) the general worsening of indebtedness indicators in recent years, as many large EM countries engaged in aggressive fiscal stimulus to offset the impact of COVID. Brazil, for example, posted a fiscal deficit of 14% of GDP in 2020.

Table 2. Public sector debt in the EMBI Index, 2001 and 2022. Percent of GDP
In Table 3 below, we have calculated external debt to GDP for the EMBI index in 2001 and in 2022, broken down by government and private debt. Total external debt to GDP in 2001 was 38%, compared with 50.4% in 2022. Notably, there has been a significant increase in private sector external debt which could represent a source of market risk during the tightening cycle. However, many of these corporates have a natural hedge, as they can often be exporters that thus generate hard currency revenues to offset their external liabilities.

Table 3. External debt and foreign exchange reserves for the EMBI index in 2002 and 2022
Source: JP Morgan and authors’ calculations
One critical development of the last two decades relates to the efforts by most EM central banks to accumulate foreign exchange reserves. While China has been the main contributor to EM reserve accumulation, other EM countries have also played a role in bringing EM FX reserves to almost $10 trillion in 2022, from less than $500 billion in the mid-1990s, see Figure 3.
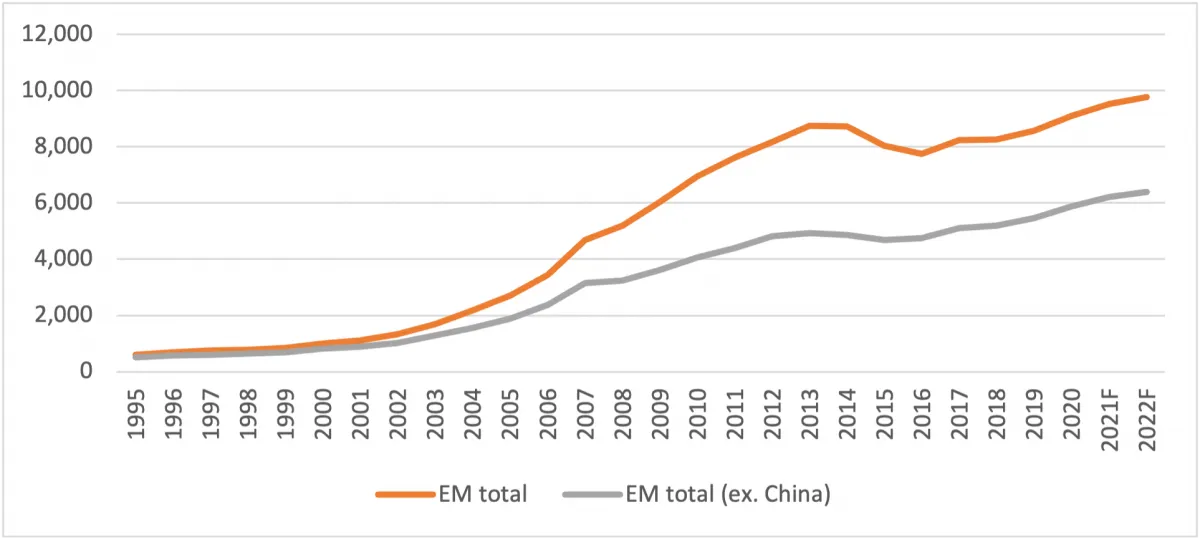
Figure 3. Foreign Exchange Reserves in Emerging Markets, 1995-2022F, $ billion
Source: JP Morgan
Foreign exchange reserves for this group of EM countries have risen to a level enough to more than cover all public external debt. So, while indebtedness in the private sector has risen, governments (in the EMBI aggregate) have become net external creditors. This balance sheet improvement is likely to play a positive role for hard currency EM debt performance over the tightening cycle.
Regarding valuations, one way to measure the attractiveness of EM is versus comparably rated indexes of high yield and investment grade bonds. The chart below show that EM debt offers a healthy spread both versus its high yield and investment grade comparables in DM, see Figure 4. Current spreads, while no longer at pandemic extremes, are still above historical averages.
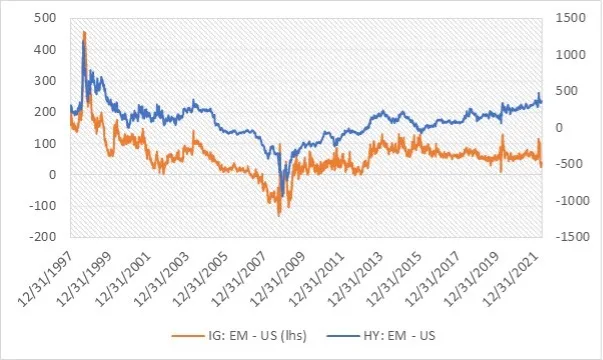
Figure 4: EM HY and IG spreads versus US in basis points (thru April 2022)
Source: JPMorgan
Key takeaways from the bond market section
- Emerging debt markets have become more diversified, which could help performance of the asset class during the hiking cycle. However, the broadening of the universe has also introduced several countries with weaker credit fundamentals, creating pockets of vulnerability. Overall, the weights of investment grade credits in the index amount to 50% versus 25% in 2000.
- Emerging markets show greater indebtedness than in the past (both in local and foreign currency) which could hinder their performance as global interest rates rise. This is particularly the case for private sector debt which has nearly doubled as a percentage of GDP in the last 20 years.
- Contributing to offset some of these concerns, we note a sizable increase in foreign exchange reserves over the last two decades. This has transformed the asset class (weighted average of EMBI) from net debtor to net creditor from a sovereign perspective.
Emerging equity markets: these are not your grandma’s emerging markets
Emerging market equities are now mostly about Asia
One of the most important economic development phenomena of the modern era is the ascent of China. Decades of strong and sustained expansion have catapulted its GDP into first place globally, surpassing the US on a purchasing power basis. In the process, China has lifted hundreds of millions of people out of poverty and forged a robust middle class. The depth and breadth of China’s financial markets have mirrored this expansion. Consider that from 2000 to 2021, the market capitalization of Chinese equities rose 13 times, compared with 3 times for the world’s market capitalization, according to the World Federation of Exchanges. Today, the combined value of the Shanghai and Shenzhen equity markets is 14.7% of the world’s, only surpassed by Nasdaq at 25%, and the NYSE at 28%.
The growing prominence of China seen in the last 20 years is paralleled to a lesser degree by most emerging Asian countries, resulting in an increase in benchmark weights for the Asian region at the expense of the less dynamic regions of Latin America, Europe and Africa, see Figure 5.
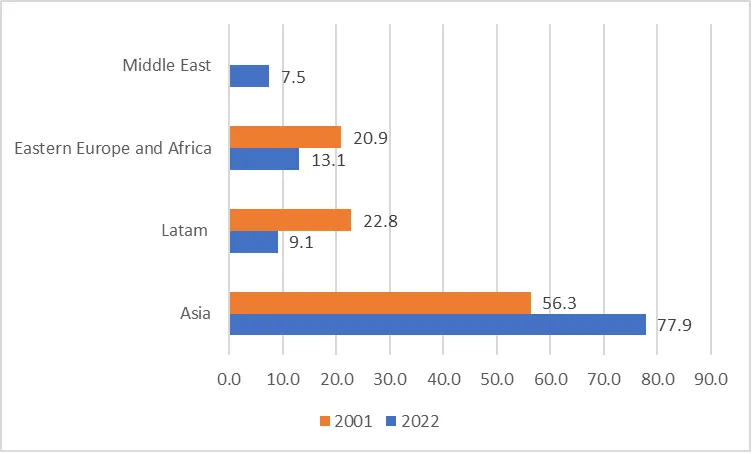
Figure 5. Regional weights of the MSCI EM Index 2001 and 2022. Percent of Index total
Source: MSCI
The result is that an investor buying any tracker of equity exposure to emerging markets today is in fact putting 78 cents of each dollar in Asian stocks and about 1/3 in China. The greater representation of Middle East stock markets, a development of the last few years, is also noteworthy. These markets had no weight in the MSCI EM benchmark twenty years ago.
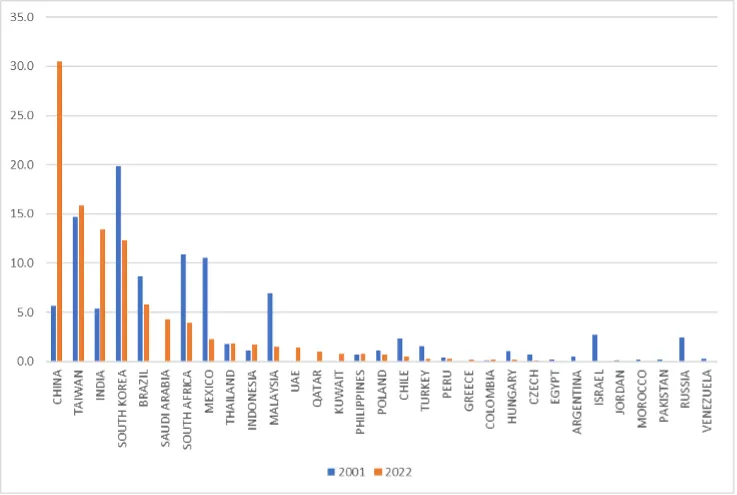
Figure 6. Country weights in the MSCI EM index, 2001 and 2022. Percent.
Source: MSCI
While a greater concentration of exposure to Asia reduces diversification benefits to a portfolio, and introduces new risks (e.g., Chinese market regulation, the zero Covid policy that is driving current sentiment), it also brings an unprecedented depth and breadth to investors in these markets in the form of higher trading volumes, a vibrant IPO market, and a myriad of sectors and industries unavailable in the EM universe 20 years ago. We discuss the changes in sector composition of emerging stock markets in the next section. However, the tilt of the indices toward Asia also provides greater exposure to emerging countries with sizable foreign exchange reserves and relatively fewer macroeconomic fragilities.
In Table 4, we show the ratio of foreign exchange reserves to external debt for the constituents of the MSCI EM Index in 2001 and 2021. Using the MSCI EM country weights, we also calculated the weighted average of the ratio for the Index as a whole, excluding Taiwan (whose very small external debt level distorts the average). As can be seen, the ratio of FX reserves to external debt has gone from 221% in 2001 to 378% in 2022. Much of this improvement, but not all, is the result of higher weightings for Asia in the Index. This incremental move in Asia reserves is a legacy of the Asian currency crisis of the late 1990s, after which many EM Asian countries opted to build a sizeable buffer against future volatility in the form of FX reserves.

Table 4. Ratio of Foreign reserves to external debt for MSCI EM constituents 2001 and 2022F
Emerging equity markets today represent mostly exposure to information technology and finance
In the last 20-30 years, emerging markets have undergone not only rapid growth but also a profound industry transformation. As we discussed above, the growth of China and Asian economies has resulted in a rapid expansion of their asset markets and greater weight in the benchmarks, at the expense of the other less dynamic emerging market regions. With the greater representation of Asian economies, the weight of technology-intensive sectors and financials has also risen. Today, 8 of the 10 largest individual stocks in the MSCI EM Index are either in the information technology or consumer discretionary sectors and one is in financials. The market capitalization of these stocks is almost $1.8 trillion, see Table 5. These top ten stocks (which account for 26% of the index) resemble more closely the NASDAQ composition than an “old” emerging market index, which was more weighted toward commodities, materials, and other cyclicals.
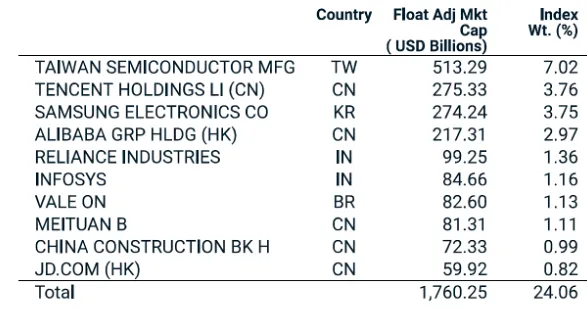
Table 5. Top 10 stock weights in the MSCI EM index, April 2022
Source: MSCI
The traditional perception that emerging markets are about commodities and agriculture relates to a reality of 30 years ago. In fact, as seen in Figure 7, materials in 2022 represent less than 10% of the MSCI index, down from 17% in 1997. By contrast, information technology is now 21% of the index, up from 5.5% in 1997. In this period, consumer discretionary, health, and real estate have all seen gains in their weights while consumer staples and utilities have seen declines. The weight of the energy sector had seen an increase in the 2000s but has declined sharply in 2022 as Russian oil and gas companies were taken out of the index due to international sanctions. Many other large energy players in EM, such as PEMEX in Mexico, remain state-owned and thus are not publicly traded.
As we stated above, all risk assets (stocks, bond, and currencies) are likely to struggle as global liquidity dries up. However, the new sector structure of emerging market benchmarks positions them better than in the past for a hiking cycle. Technology companies are growth companies with idiosyncratic drivers, less dependent on the macro cycle. As growth becomes scarce in the latter parts of the cycle, these companies should fare better. Banks benefit from higher rates if the yield curve does not experience prolonged inversion. Technology and financials represent almost half of the MSCI EM index; 2/3 of the index is accounted for if we add consumer discretionary (mostly e-retailing. e.g., Alibaba). On the other hand, low valuation, high dividend stocks which are more sensitive to global interest rates in the Industrial and utilities sectors now represent a combined weight of less than 10%.
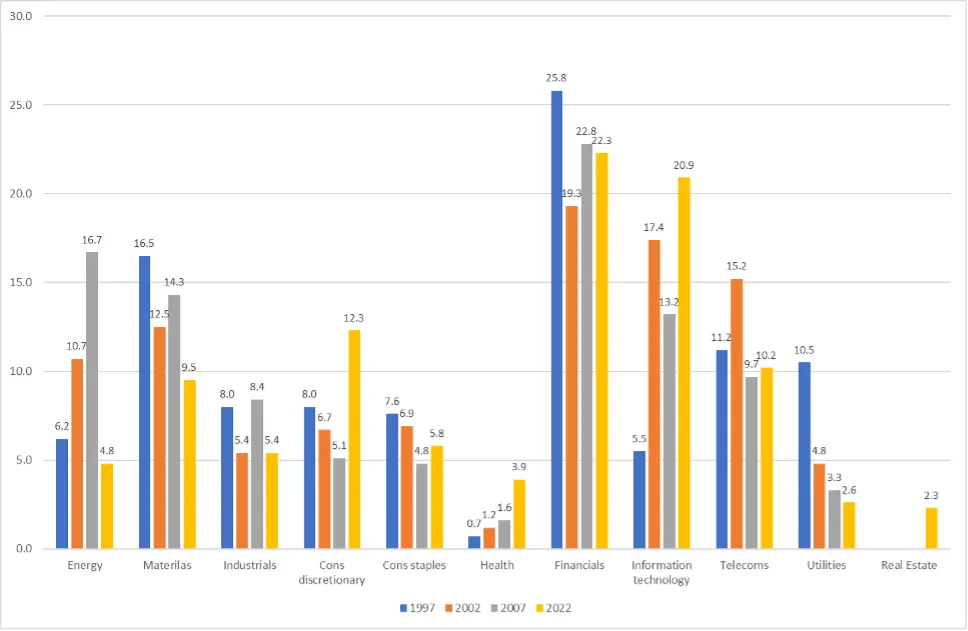
Figure 7. Sector weights in the MSCI Emerging Market Index, 1997, 2002, 2007, 2022
Source: MSCI
When comparing the sector exposures of EM equity markets to developed equity markets, financials and materials are more prevalent while healthcare and industrials are less so, see Figure 8. As mentioned, more exposure to financials would most likely be beneficial in a hiking cycle assuming that yield curves do not invert too significantly or for too long. Materials have also historically benefited from robust growth underlying most hiking cycles. The reduced exposure to healthcare is more ambiguous. Hospitals tend to behave like defensive utilities; however, as the Covid pandemic has shown, modern pharmaceutical companies included in this sector are in fact technology companies with rapid earnings growth prospects. Thus, reducing exposure to them in a hiking cycle may not be the most effective move and may offset higher exposure to financials.
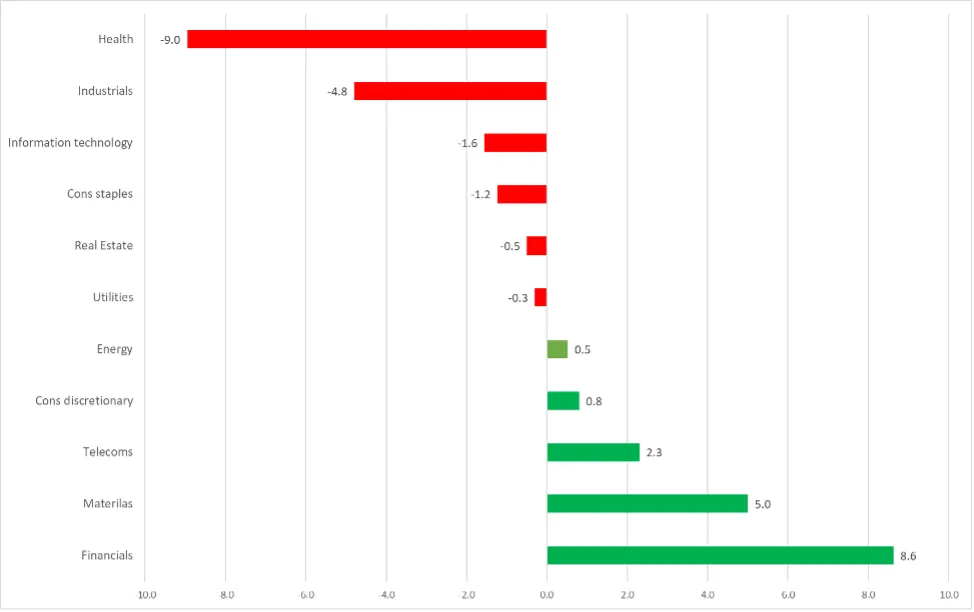
Figure 8. Sector weights of the MSCI Emerging Markets index minus the MSCI World, March 2022
Source: MSCI and authors’ calculations
The jury is therefore out as to whether emerging equity markets would outperform developed counterparts. Much will depend on how financials perform versus healthcare during the current cycle. History may not provide sufficient guidelines in some rapidly evolving areas like pharmaceuticals. Nonetheless, the current sector structure of the MSCI EM index suggests that EM equities should perform more in line with their more developed market counterparts.
One final reason why Emerging Markets may perform well relative to Developed Markets in the hiking cycle is due to low valuations. As seen Figure 9, the forward P/E ratio of 11.9X in the MSCI EM index as of March 2022 represents a 32% discount to the MSCI World P/E ratio. On a P/BV basis, the discount is 44%. These discounts are not explained by sector composition and are larger than historical discounts of around 20% for P/E multiples and 30% for P/BV. Instead, these discounts may be explained by transitory phenomena like the Russian war on Ukraine and the pandemic challenges currently facing China.
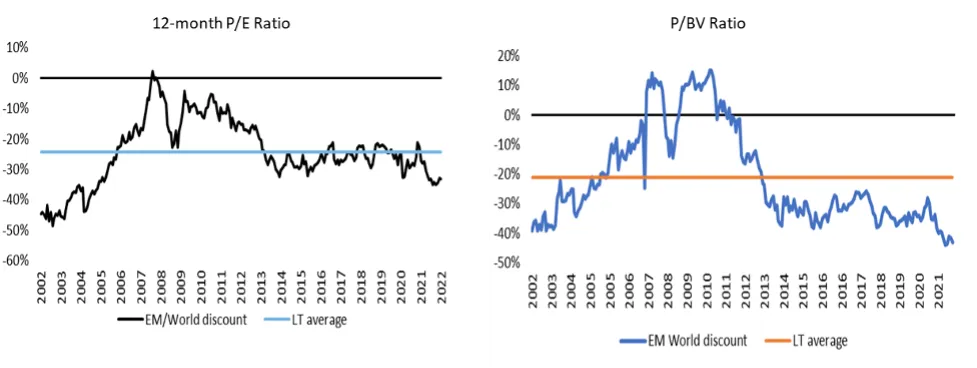
Figure 9. MSCI EM Forward P/E and P/BV ratios 2002-2022
Source: MSCI
Key take aways for the equity markets
- Country exposure to China and Asian markets now accounts for 80% of EM benchmarks. This makes the index more resilient to the current hiking cycle, as Asia’s balance sheets are stronger than in the average EM country and macroeconomic imbalances are less pronounced.
- The weighted average ratio of foreign exchange reserves to government external debt for the MSCI EM Index has gone from 221% in 2001 to 378%. This is in part due to country composition and partially the result of reserve accumulation by most EM countries in the period.
- This concentration in Asia, however, reduces diversification benefits and introduces new idiosyncratic risks. Recent market stress emanating from China is an example of this.
- EM equity markets are better positioned to face higher interest rates than in past hiking cycles owing also to greater exposure to information technology and financials, itself the result of greater exposure to Asia.
- Though EM equity markets should benefit from greater exposure to financials than developed markets, these benefits are limited by reduced exposure to healthcare, a sector that could perform well in a hiking cycle.
- EM stocks are likely to perform more along the lines of their developed counterparts. One reason why EM stocks could perform well are greater than average historical valuation discounts relative to developed markets.
Emerging market currencies are not sinking at the prospect of higher global rates
Many EM Central Banks are ahead of the curve
As global inflation climbed and the inflection point of US monetary policy approached late into 2021 and early 2022, emerging market currencies were expected to depreciate, as they historically have, under the weight of an appreciating mighty dollar. To everyone’s surprise, most emerging market currencies have held up rather well compared to previous cycles, see Figures 10.
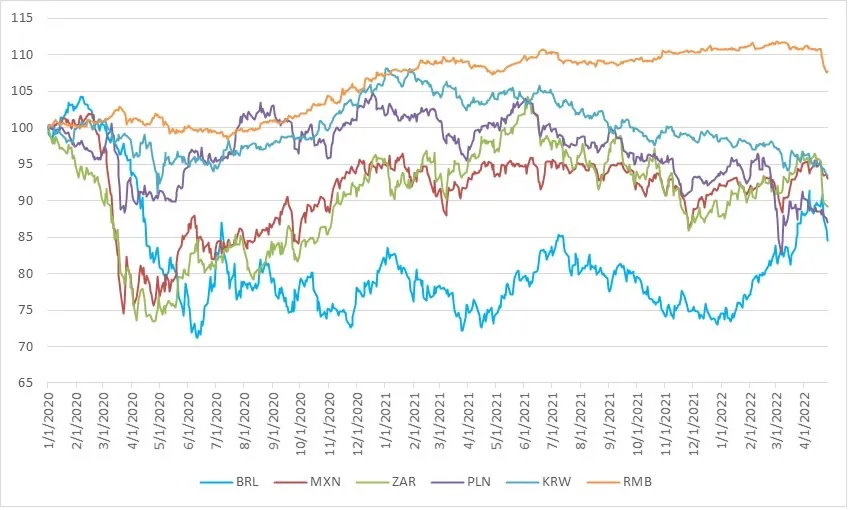
Figure 10. Performance of selected emerging market currencies vs the USD, Jan 1, 2022=100
Source: Bloomberg
The main reason is that many emerging markets central banks began raising rates several months ago and are now “ahead of the curve” when compared with the Fed or the ECB. Table 6 shows the real policy rate for Emerging Markets, weighted by the composition of the Emerging Local Market Index (ELMI+), as well as real policy rates for some developed markets. Using this composition and calculating the expected policy rate for the end of 2022 minus expected inflation for end 2022, we see that the real rate for EM is -2.4%, compared with -4.1% for the US and -5.2% for the EU. However, this average reflects the negative real rates in EMEA countries such as Poland, Romania and Czech Republic, and it gets distorted by the very negative real rate in Turkey, where the central bank runs a policy rate of 14% despite expected 2022 inflation of around 50%. Emerging Asia also displays modestly negative real rates, though China’s real rate is 1%. Latin America’s real rate stands at 2.5%, a major pickup over the US, the EU and Japan. This real yield pickup is a major explanation for why the Brazilian real - and to a lesser extent the other major Latin American currencies - have performed so well in recent weeks. In a world of highly negative rates within DM and major regions of EM, Brazil stands out with a real rate of over 6%.
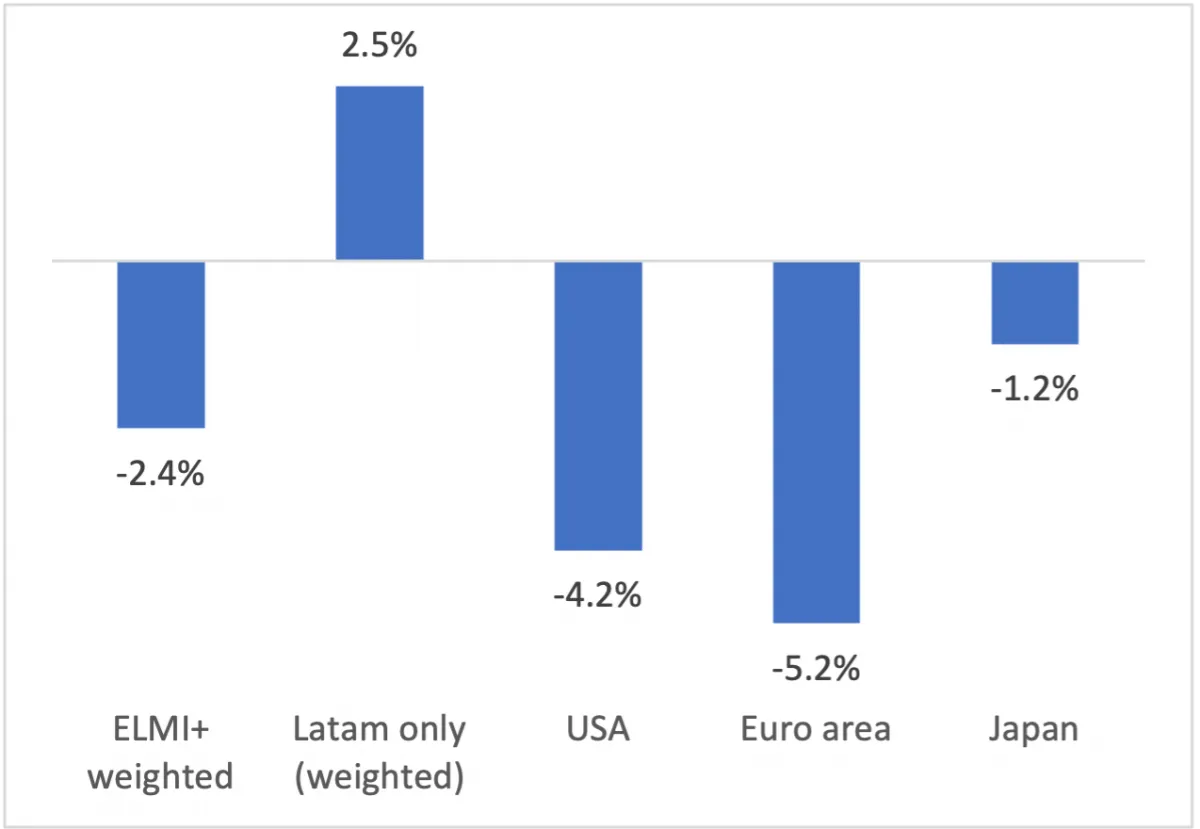
Figure 11. Real interest rates in EM and DM., April 2022 (expected rate end-2022 minus end 2022 CPI)
Source: JP Morgan and author’s calculations
While on the aggregate, EM real rates have some advantage versus their counterparts in DM, the above analysis points to pockets of vulnerability to tightening global liquidity in the EMEA region where central banks have been slower to react to inflationary pressures. On the other hand, Latin American currencies such as the Brazilian real and the Mexican peso are likely to remain more resilient to higher global rates. The same can be said for the renminbi and other Asian currencies.
The US dollar may still rise as the tightening cycle progresses and US rates rise further. This would most certainly have a negative impact on EM currencies and EM assets in general. However, relatively higher interest rates and sizable foreign exchanges reserves position EM currencies better than in previous hiking cycles.
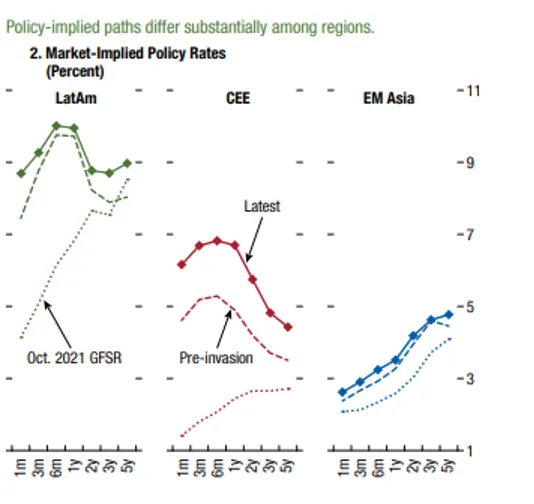
Figure 12. Policy-implied paths by region
Source: IMF
3.2 Key takeaways for EM currencies
- Compared with previous tightening cycles, EM currencies are supported by higher real yields and a larger coffer of foreign exchange reserves.
- Within emerging currencies there are pockets of strength, like Latin America, where real rates are highest, and areas of weakness, such as Turkey and the Eastern Europe, where real rates are deeply negative. Asia falls in the middle with China exhibiting positive real policy rates.
- An extended period of US dollar strength would most likely have a negative impact on EM currencies and assets in general, but the initial conditions of most EM seem more robust than in previous hiking cycles.
General Conclusions
- As we transition into the ongoing global tightening cycle and global rates rise, risk assets in general will likely underperform the periods of liquidity expansion and near free money the world has enjoyed in the recent past. However, changes over the last two decades in market depth, macroeconomic strength, and industy structure in emerging markets suggest that they are better equipped than in the past to face rising global interest rates.
- EM indebtedness has increased in both external and local currency terms in the last 20 years. Corporate debt has almost doubled relative to GDP from 2000 to 2022. This area of the market can become a source of stress as global rates rise. However, foreign exchange reserves have risen faster than hard currency government debt, making the weighted-average EMBI government a net creditor. A crisis of hard currency sovereign debt among major EM countries is therefore less likely than in the past.
- In the equity markets, the most important development is the preponderance of China, India and the rest of Asia which combined account for almost 80% of equity market capitalization. When compared with other EM regions, Asian economies display more intrinsic growth drivers, larger buffers of FX reserves, and fewer macroeconomic fragilities. At the sectoral level, emerging markets have shifted concentration away from commodities, materials, and utilities in favor of information technology and banks. Both the new country and sector mix of this asset class suggest that EM can fare better than in previous down liquidity cycles.
- Finally, unlike the hiking cycles of the 80s, 90s and 2000s, EM currencies are supported by higher real interest rates and larger foreign exchange reserves. While there are areas, like Eastern Europe, where policy rates have lagged inflation, there are also areas of strength, such as Latin America, where central banks have been hiking for a few months ahead of the Fed.
Each global liquidity cycle is different, as there are many intervening factors shaping final market outcomes. In this cycle, the Covid-19 pandemic and the Russian invasion of Ukraine infuse the future with greater uncertainty. Yet, based on the economic developments and structural changes which have taken place over the last two decades, we believe emerging markets are in better position to absorb a hiking cycle than they have been previously. When the tide pulls back, some EM countries may be wearing skimpy clothes, but the asset class will not be naked.
Jorge Mariscal is Adjunct Professor at the School of International and Public Affairs at Columbia University and former Chief Investment Officer for the Emerging Markets at UBS Wealth Management.
Bret Rosen is based in the New York office of Itau USA Asset Management and has held portfolio manager and EM macro strategist roles with the Brazil‐based manager.